Real-Time Spectrogram
(RTS
tm )


Home | Company | Products | Sales | Support | What's New | SIGNAL in Science | Contact | Search


View, edit, and measure digital sound files

Click here to download a PDF brochure


Overview


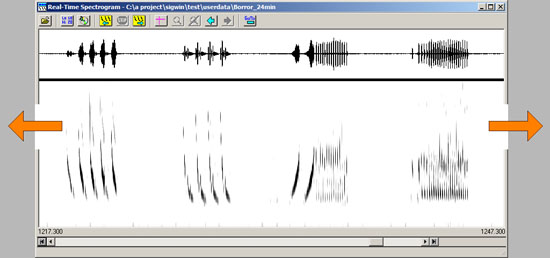
The Real-Time Spectrogram (RTS) displays the time-aligned spectrogram and waveform of a continuous sound file. The RTS can efficiently review large amounts of acoustic data, while measuring, extracting, and storing sound parameters and sound segments directly from the screen.

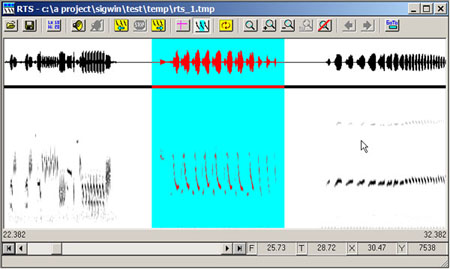
RTS is designed to efficiently analyze entire sound files. The user can navigate through the sound file rapidly, auditioning, editing, measuring and storing sound events of interest.

RTS is highly integrated with SIGNAL. You can transfer sound events to SIGNAL buffers for analysis and store measured sound parameters in the SIGNAL logfile. You can save sound segments as SIGNAL, Wave or AIFF sound files. You can display SIGNAL buffers in any number of scrolling RTS windows for visual comparison.

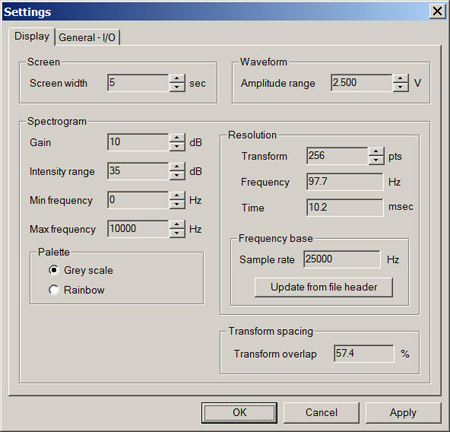
Display parameters such as screen width, waveform amplitude range, spectrogram intensity and dynamic range, frequency resolution, and frequency range can be adjusted from a simple settings screen. Spectrograms can be displayed in grey levels or a rainbow color spectrum. Spectrogram intensity and range can be adjusted to eliminate background noise from the spectrogram.


Highlights


View sound files of any length: RTS can handle sound files of unlimited length. Screen width can be adjusted from a fraction of a second to an hour, to zoom in on detail or survey the data to spot sections of interest.


Scroll or page rapidly forward or backward: The RTS can scroll forward or backward through a sound file to search for events interest. For example, this 30-second screen was scrolled in 3 seconds - a review rate of 10 times real-time! The user can also page through the sound file in either direction at 15 times real-time.


Time/frequency zoom: Zoom the time and/or frequency scale to enlarge sound features or view a specific frequency band. Navigate forward and backward between multiple zoom levels like a browser. Redisplay the last 10 screens from memory. Edit long signals precisely at high magnfication.


Drag-highlight signal segments in RTS allows for quick zooming, editing, measurement, and export.


Play back selected sound segments: Select any sound segment on the screen for playback through the system sound card.


Measurement cursor and built-in measurement datafile: Use a screen cursor to measure sound parameters, such as start times, note and sound durations and intervals, and peak frequencies. Store these measurements in the SIGNAL measurement logfile, which can be customized by the user to the exact number and type of measurements. Export the logfile to a spreadsheet or statistical program for further analysis.


Efficiently review sparse data sets: Use the wide screen and high-resolution spectrogram of the RTS to locate significant events in sparse data sets. The RTS can display very long segments (such as 5 minutes shown here), then zoom individual events for close examination. With 3 seconds to draw or scroll a new screen, this allows sparse data sets to be analyzed at 100 times real-time.


Detailed grey-scale and color spectrograms: Display spectrograms in grey levels or in color, to highlight significant amplitude features. Adjust noise floor to minimize background noise in the spectrogram.


SIGNAL/RTS link: sound events can be transferred from RTS to SIGNAL buffers for analysis, and measured sound parameters can be transferred to the SIGNAL logfile. In the figure, the RTS has saved 6 events in SIGNAL buffers and 11 measurement records in the SIGNAL logfile.


Flexible parameter adjustment: Adjust display parameters such as screen width, waveform amplitude range, spectrogram intensity and dynamic range, frequency resolution, and frequency range from a simple settings screen.